

Back to all blogs


11 SaaS metrics to track (and their limitations)
Subscribe to the Dialpad newsletter
Loading
Thank you for subscribing!
Want to work with us?
See open jobs

April 08, 2022
One of the joys of working in SaaS (Software as a Service) is that you have countless data points at your fingertips, covering every stage of the customer journey. It can feel like you are the person in the chair at NASA mission control.
So why can’t every SaaS company translate this abundance of analytical insight into multi-million dollar success?
One of the (many) reasons is that, while data access in SaaS companies remains high, data literacy and understanding doesn’t always match up. Particularly when it comes to applying critical thinking to data.
SaaS metrics are like flashlights—they shine a light on a specific area of your business performance, but, on their own, they rarely tell you the full story.
There are many types of customer engagement metrics that you may want to measure. As you build your KPI strategy we wanted to give you a rundown of 11 of the most important metrics for SaaS companies. Alongside some of the limitations of those metrics so you can better put them in context.
Which SaaS metrics will we cover?
CSAT
MRR
Burn Rate & Cash Runway
CAC, LVT & CAC/LTV Ratio
Conversion Rates
DAU, MAU, and DAU/MAU Ratio
CSAT
1. CSAT
By far, CSAT is the most commonly used customer support metric in SaaS companies.
CSAT (Customer Satisfaction) is taken from a simple customer survey which gauges how satisfied the customer is with the support they received. (For example, on a scale of 1-5, with 5 being very satisfied)
You can calculate CSAT as follows:
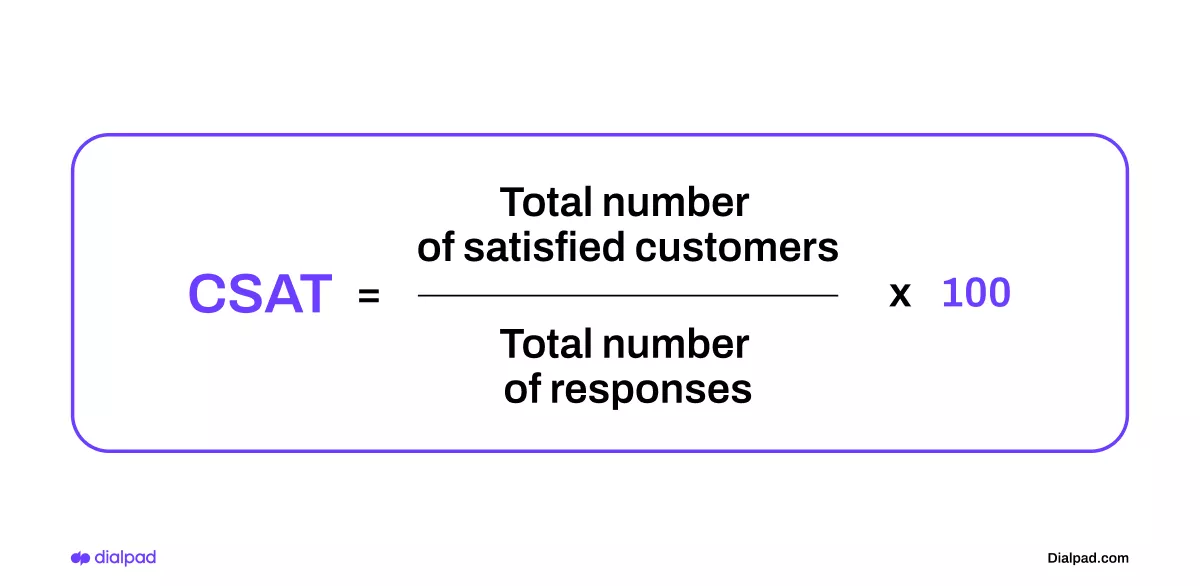
For example, if 10 people respond to our survey and 9 people give a positive response (i.e. they score 4 or 5) then our CSAT would be 90%.
Because 9/10 = 0.9 (or 90%)
CSAT is an excellent indicator of how effectively your customer service team is resolving customer queries and complaints. It very quickly identifies issues in your team that are causing unhappy customers.
This is why many customer service teams choose to visualize CSAT (alongside other important customer service metrics like First Response Time) in the form of a live KPI dashboard, so they can instantly respond to any dips in CSAT as they happen.
Limitations of CSAT
The main limitation of CSAT is that there’s typically a low response rate, and is therefore prone to sampling errors.
A non-representative sample of CSAT scores can skew your data. Luckily, Dialpad has AI CSAT, which helps contact centers analyze their conversations and predict the CSAT score of every call.
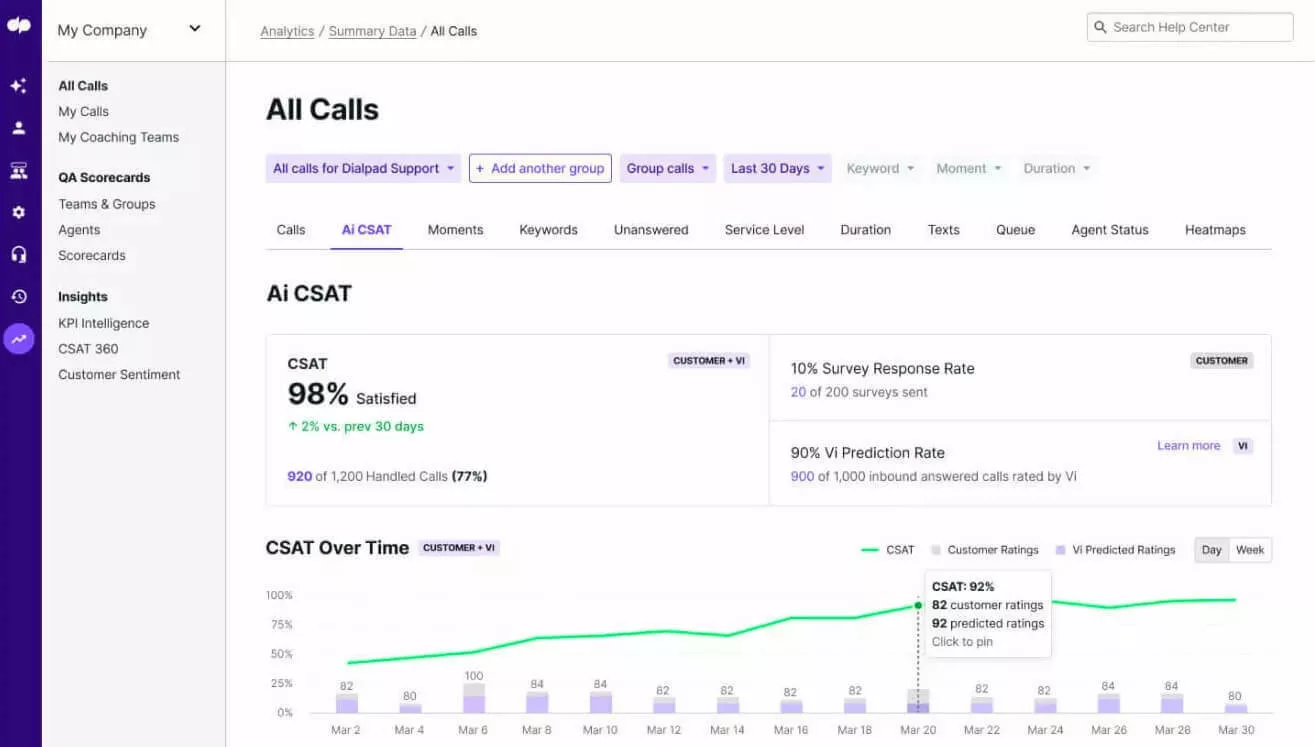
This helps prevent underestimating the number of happy customers out there who did not have any issues or overestimating the number of dissatisfied customers.
2. MRR
In SaaS, Monthly Recurring Revenue (MRR) is the big boy.
So much so that some founders even maintain a live MRR progress bar on their Twitter profile—sharing their revenue generation with the world. (Talk about accountability…)
MRR is designed to produce a normalized revenue metric, which would be otherwise skewed by the variance of subscription-based models.
In other words, MRR corrects for the variance that occurs when:
some customers pay annually
some pay monthly
customers pay at different times of the month
customers who upgrade and downgrade their plan
So MRR presents us with a much more reliable figure for assessing company performance and growth over time.
MRR is calculated as follows:
MRR = Number of Customers x Average Monthly Billed Amount
So, for example, if you have:
100 active paying customers
50 are on annual subscriptions of $120 per year
50 are on monthly subscriptions of $15 per month
Your MRR would be $1,250, because:
50 customers are paying $15 per month and 50 are paying the equivalent of $10 per month
So the overall average monthly billed amount is $12.50 per month.
100 customers x $12.50 = $1,250 MRR
(You may also see companies use Annual Recurring Revenue (ARR) which is simply calculated by multiplying the Number of Customers by the Average Annual Billed Amount. The metric functions in the same way as MRR.)
Limitations of MRR
MRR is helpful because it simplifies and normalizes what can often be quite complicated pricing and revenue models. This reliable and high-level view of your company performance allows you to make clearer, strategic business decisions.
However, the reasons MRR is good for high level analysis are also the reasons why it can be limited at a more granular level.
It doesn’t explain the drivers of growth: For example, MRR takes into account total revenue changes from new customers, existing customers, upgrades, downgrades and revenue churn. In order to understand the forces behind your MRR, you will likely also need to track things like New MRR, Expansion MRR (i.e. increased MRR from upgrades and price changes), and monthly churn.
There is still variance: Although MRR normalizes your revenue figures, you shouldn’t forget that there is still likely to be variance day-to-day and even month-to-month. For example, if 50% of your annual subscribers renew in June, you can expect to take a hit on MRR in June because of the increased likelihood of losing more annual customers that month. Short-term MRR changes are not the be-allbe all and end-allend all. It’s the overall month-on-month trend that is most important.
Cash. Like most revenue models, MRR is disconnected to your immediate cash flow. Remember, it’s possible to have a healthy MRR but no cash in the bank. You will need additional systems to track cash flow.
3-4. Burn Rate and Cash Runway
Burn Rate and Cash Runway are popular metrics for measuring cash flow in SaaS companies.
Burn Rate
Burn Rate is the amount of money you are spending each month.
Monthly Burn Rate = Cash at the beginning of the month - Cash at the end of the month
It’s possible to have a negative Burn Rate where you finish the month with more money than you started (effectively, profit). However, the reason we talk about Burn Rate in the startup/SaaS world is because businesses are usually focused on reinvesting capital in order to drive rapid growth.
Cash Runway
Cash Runway takes Burn Rate one step further. It indicates how long your cash would last if you continued at your current Burn Rate.
You can calculate Cash Runway as follows:
Cash Runway = Cash Balance / Monthly Burn Rate
For example, if you had:
$1,200,000 in the bank
and a Monthly Burn Rate of $100,000
Your Cash Runway would be 12 months.
Because 1,200,000 / 100,000 = 12
Tracking cash is crucial for any business. Burn Rate and Cash Runway are popular in SaaS because they reflect the fact that—because of regular subscriptions—SaaS businesses tend to be reasonably stable month to month. These metrics also help you to respond to changes in cash flow quickly.
Limitations of Burn Rate and Cash Runway
One of the things to keep in mind with Burn Rate and Cash Runway is that despite the fact they give the impression of being leading indicators, (i.e. predictive measures) they are not. They are lagging indicators. In other words, they are a measure of what has happened, not what is likely to happen in the future.
As with any business or business model, significant operating costs can come out of nowhere, particularly annually billed expenses, or expenses related to growth, such as new hires. That’s why Burn Rate, although a good health metric, should never be seen as a replacement for proper forecasting models which take into account predicted revenue and expenses.
📚 Further reading: Here’s Geckoboard’s guide to 90+ more business metrics.
5-7. CAC, LTV, and CAC/LTV ratio
For many SaaS companies, Customer Acquisition Cost (CAC) and Customer Lifetime Value (LTV) lie at the bedrock of their marketing and growth strategy.
CAC is the total cost of acquiring one customer. A rough way to calculate CAC is as follows:
CAC = Total Marketing and Sales Spend / Number of customers acquired
Whereas LTV (Sometimes called CLV) is the expected value of the customer over their total lifetime. You can calculate in the following way:
LTV = Average Monthly Revenue (per customer) x Average Customer lifetime (in months)
CAC/LTV ratio
CAC/LTV ratio (or CAC:LTV) takes these metrics one step further in the form of a ratio. It helps businesses monitor the overall viability of their sales and marketing efforts.
For example, a business with a CAC of $50 and LTV of $100 would have a CAC:LTV Ratio of x2.
Because for every dollar they spend, they see a return of 2 dollars.
A negative CAC/LTV ratio means you are spending more to acquire customers than you gain in customer value. This would indicate that your marketing spend is unsustainable in the long term.
However, it should be noted that “overspending your way to growth” (especially early on) is a common tactic with VC-funded SaaS startups, who plan to capitalize on their increased market share at a later date, when the business has matured.
Limitations of CAC and LTV
CAC and LTV can both be enormously helpful in giving context to decisions about your marketing investment. However, you should be aware of their limitations.
They measure different samples of customers at different points in time
LTV is normally calculated based on historical customer information. (Indeed, it needs to be historical to understand the full lifetime value of customers.) Whereas CAC is generally looking at more recently acquired customers. The problem is that there is no guarantee these new customers will behave in the same way as previous customers.
Suppose your recent marketing efforts targeted a new customer segment to great success. They have drastically brought down the CAC. But will their LTV be the same? It might be, or it might not. This is a lagging indicator, which will only become apparent over time.Marketing attribution is always difficult
True CAC is hard to attribute. Particularly when you consider that, in reality, acquisition is not just driven by short term promotional campaigns but also by longer term brand awareness and word of mouth.
In practice CAC:LTV is a good sense check of short-term activities. But, as Adidas showed, strict attribution models can result in some bad miscalculations.
8. Conversion rates
That’s right, here we’re going to address all types of conversion rate, from CTR (Click Through Rate) to Activation Rate.
Conversion rates can take many forms (e.g ecommerce CRO), but essentially it measures the proportion of customers who progress from A to B.
A (or B) might be an ad, a landing page, a signup form, a free trial, a payment, and so forth.
Because of the readily available data on customer journeys and behavior, most SaaS companies rely on conversion rates to assess overall effectiveness. One of the more popular models is Pirate Metrics (AARRR) which measures conversion rates at every stage of the customer funnel. AARRR stands for:
Acquisition
Activation
Retention
Referral
Revenue
When used wisely, and with critical thinking, conversion rates are a powerful tool in any SaaS business’ toolkit.
However, there are pitfalls.
Limitations of conversion rates
Conversion rates are also some of the most widely misused metrics in all of SaaS.
Why?
Because conversion rates encourage us to look at steps in the user journey out of context. And in particular, can sometimes cause us to forget the most important element in the user journey—the user.
Let’s consider an example.
My SaaS business Photo-Editorz has just launched a new digital campaign. The Ads are performing brilliantly and have a conversion rate of 40%. But the landing page has a conversion rate of 0%.
Gee, (I think to myself), there must be something seriously wrong with my landing page. So I start to edit and optimize. After weeks of work, A/B testing and new content, my landing page is still converting at a rate of 0%.
At this point, someone points out that our digital agency made a mistake and used creative from another account they were working on. The ads they are running say nothing about my photo editing service. In fact, they are promoting free ice cream to college students.
My 0% converting landing page represents nothing more than a bunch of frustrated, bargain-hunting students with a sweet tooth.
This is, of course, a ridiculous example, but it highlights an all-too-common pitfall with conversion rates—when we start to over-compartmentalize our thinking about the user journey.
Conversion rates can highlight a broken form, or an ineffective step in the user journey. But just as often, the real issue is further up the funnel. Often, the issue is with the target audience itself.
9-11. DAU, MAU, and DAU/MAU Ratio
DAU (Daily Active Users) is the total number of users who engage with your product or service over a 24 hour period. (What counts as ‘engaged’ is something which you can define in terms that most make sense to your business. For example, it may mean accessing a platform, or taking a specific action).
MAU (Monthly Active Users) is the total number of users who engage with your product or service over a month-long period (or 30 days).
If you’re skeptical of the importance of DAU, you should note that at the beginning of 2022, Meta announced a drop in Facebook’s DAU for the first time in its 18 year history. The drop was less than 0.1% (from 1.930 to 1.929 billion daily users) but coincided with a whopping $200 billion drop in Meta’s stock price.
DAU/MAU ratio
DAU and MAU can be combined to form a DAU/MAU ratio. This is simply:
Daily Active Users / Monthly Active users
So if you have:
100 Daily Active Users
And 500 Monthly Active Users
Your DAU / MAU ratio would be 20%.
Because 100 / 500 = 0.2 (or 20%)
DAU/MAU ratio indicates the ‘stickiness’ of your product. Effectively, it measures what proportion of your users are returning to use your product on a regular basis. SaaS companies aim for a good DAU/MAU because it means that their software has become an integral part of their customers’ daily workflow, meaning they are much less likely to churn.
Limitations of DAU/MAU
Like all of the metrics we’ve covered so far, DAU/MAU requires critical thinking to be used effectively. Watch out for the following pitfalls.
Benchmarking
One of the main drawbacks to DAU/MAU in SaaS is identifying the appropriate benchmarks and targets for your own product or business.
Often you will hear people talk about gold standard DAU/MAU ratios of 50% or higher. But often, these are referring to products where you would expect the DAU/MAU to be high (such as a messenging app). It’s possible to be valuable to customers without being something they use everyday.Sometimes, the inverse can be true
DAU/MAU is most useful when daily usage is actually aligned with your value proposition. Social media companies who make money from advertising strive for as much engagement as possible. But this is not the case for all products and services.
For example, take a SaaS product that is designed to support company payroll—a process that typically takes place once per month. For Finance teams, managing payroll is something they want to do as quickly, accurately and efficiently as possible. So a system that does this well, will demand as little user engagement time as possible. DAU / MAU is therefore not a helpful KPI in this instance.
How to get smarter with your SaaS metrics
For any successful SaaS company, tracking these metrics is just the first step.
At Geckoboard, we believe the most powerful thing companies can do with their data is create greater awareness of it within the wider team. Because when teams start to build a familiarity with their data, they begin to understand it more – talk about it, interrogate it. We help SaaS businesses do this with an easy-to-create, live, dashboard tool, which the whole team can see.
However you work with your KPIs, just remember that metrics are never deterministic and no business can be painted-by-numbers. The context of your business is unique. Tracking the right metrics will help you to understand what’s going on, but only if you apply critical thinking.
CSAT is a key metric every SaaS should regularly monitor, but very few customers actually provide this score. With Dialpad Contact Center, you'll have a better idea of how satisfied your customers truly are.
Get a demo
