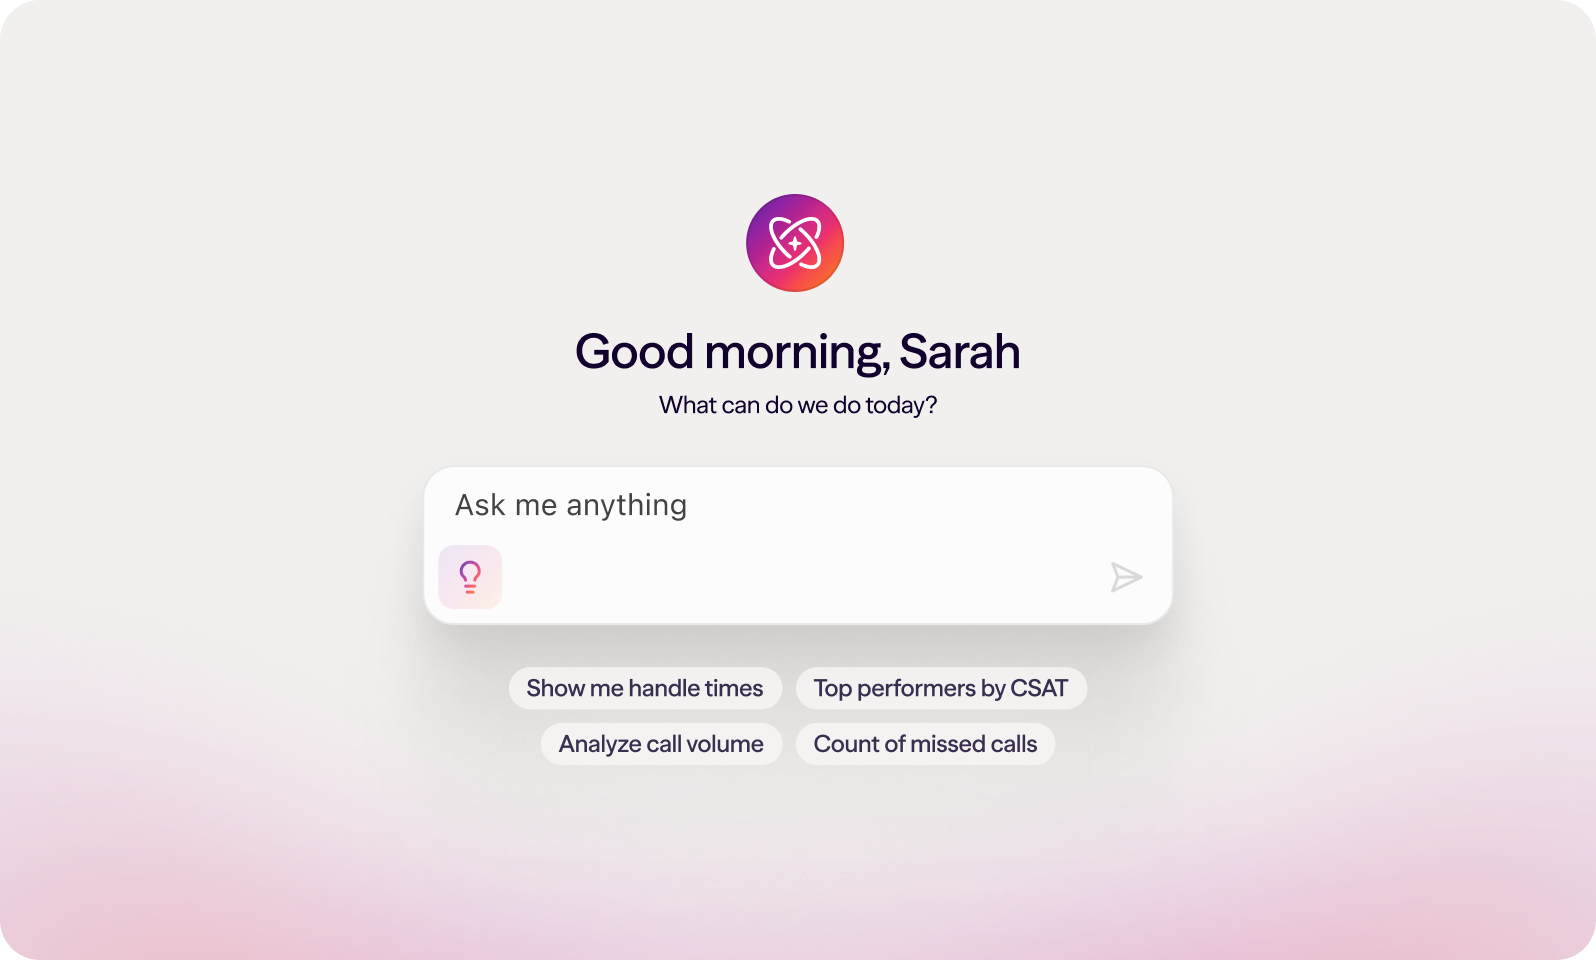
Welcome to conversational analytics: Got questions about your Dialpad data? Ask away.

Sr. Product Manager
Tags
Share
AI has transformed our world in ways we never could have imagined, from creating stunning designs to delivering personalized content and tailored workflows. Intelligent automation has given humanity our most precious gift: time. But one often overlooked aspect of all these advancements is how we extract insights from the very thing that powers them—data—and how much better we could get at it than we have been so far.
Dialpad’s CCaaS platform holds incredibly rich analytics, but too often they’re spread across multiple dashboards and tailored to specific customer segments. Metrics like abandoned calls, SLA performance, and missed calls appear in both live dashboards (designed for real-time decisions and action) and historical boards (intended for long-term customer experience strategies). Managers spend valuable time hopping between dashboards, gathering and downloading metrics, and manually analyzing them before they can act.
That’s changing today.
As part of our AI Agent launch, we’re excited to enhance Dialpad’s analytics with conversational AI that helps you instantly understand your data, derive faster insights about it, and build custom dashboards to display it—all using natural language. It’s a platform-wide UI for knowledge discovery that will let you spend your time acting on your data, instead of navigating to find it.
Here’s a look at the key ways you can expect to benefit from conversational analytics, starting now and in the weeks and months to come.
Understand what your numbers really mean
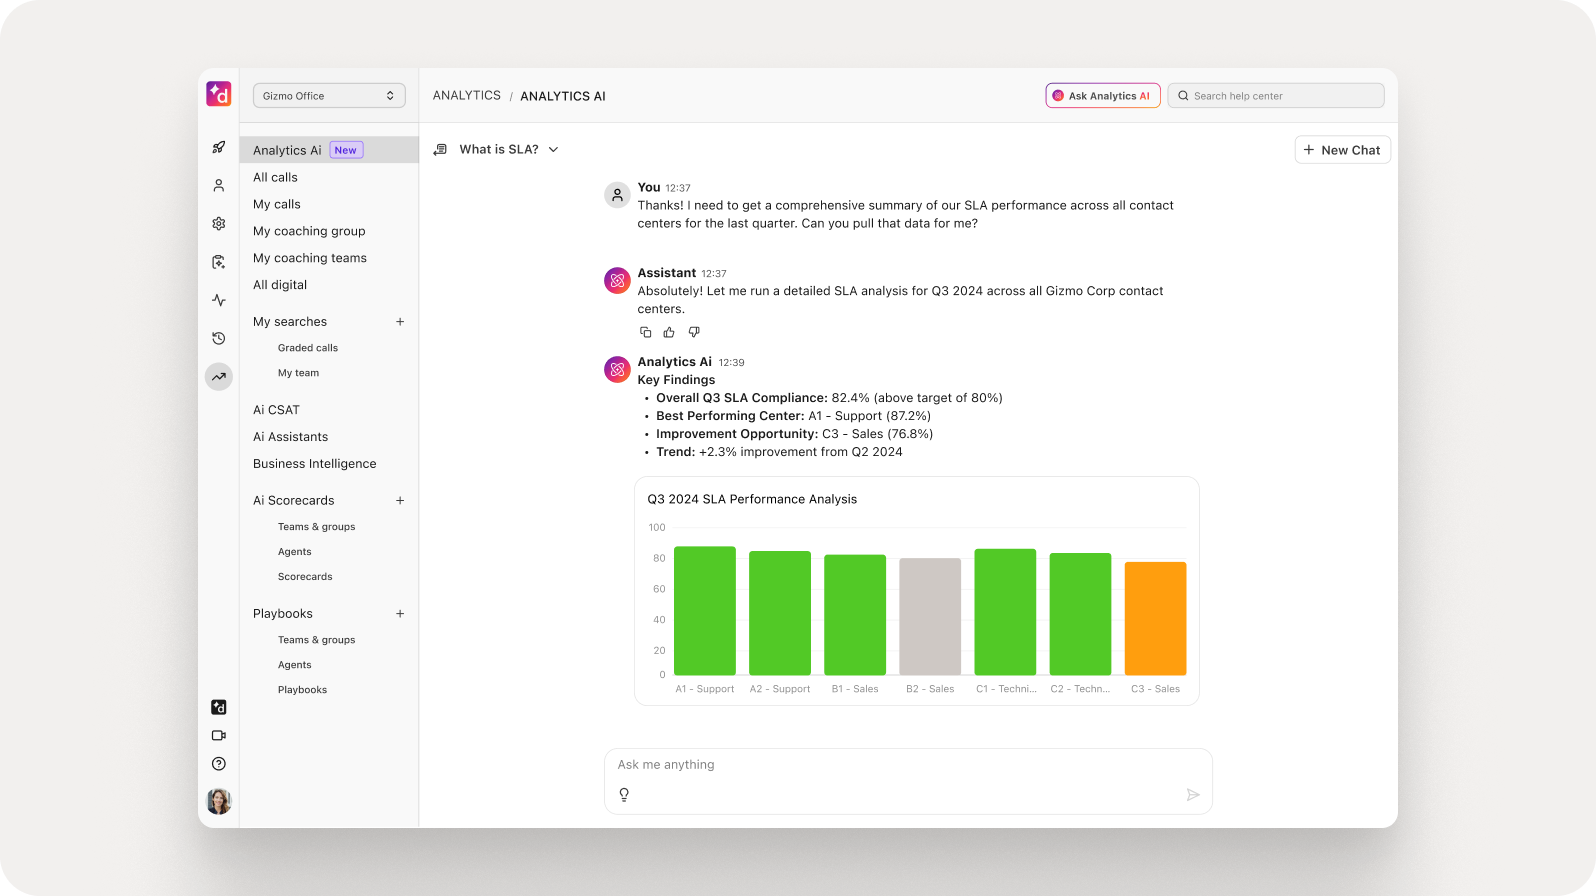
For contact center supervisors, performance metrics are only as useful as their formulas, which aren’t always as straightforward as they seem. Does handle time include the time a call spends in the queue, or only the time an agent and caller spend talking? If you’re tracking whether agents pick up calls within 30 seconds, does average speed of answer include the routing time before an extension rings, or only from the first ring until they pick up?
When you’re trying to coach agents, set goals, or explain results to leadership, these distinctions mean a lot, and navigating them has been harder than it should be; you’d have to juggle dashboards, documentation, and help center articles to decode how a single metric is calculated.
Now you can just ask Analytics what’s included in a given metric and get a clear, complete explanation in response. By making formulas transparent and accessible through a simple chat interface, we’re helping supervisors derive real insight from their data, without guesswork or endless digging. It’s a faster, clearer way to ensure the metrics you use are metrics you can trust.
Visualize knowledge however you need to see it
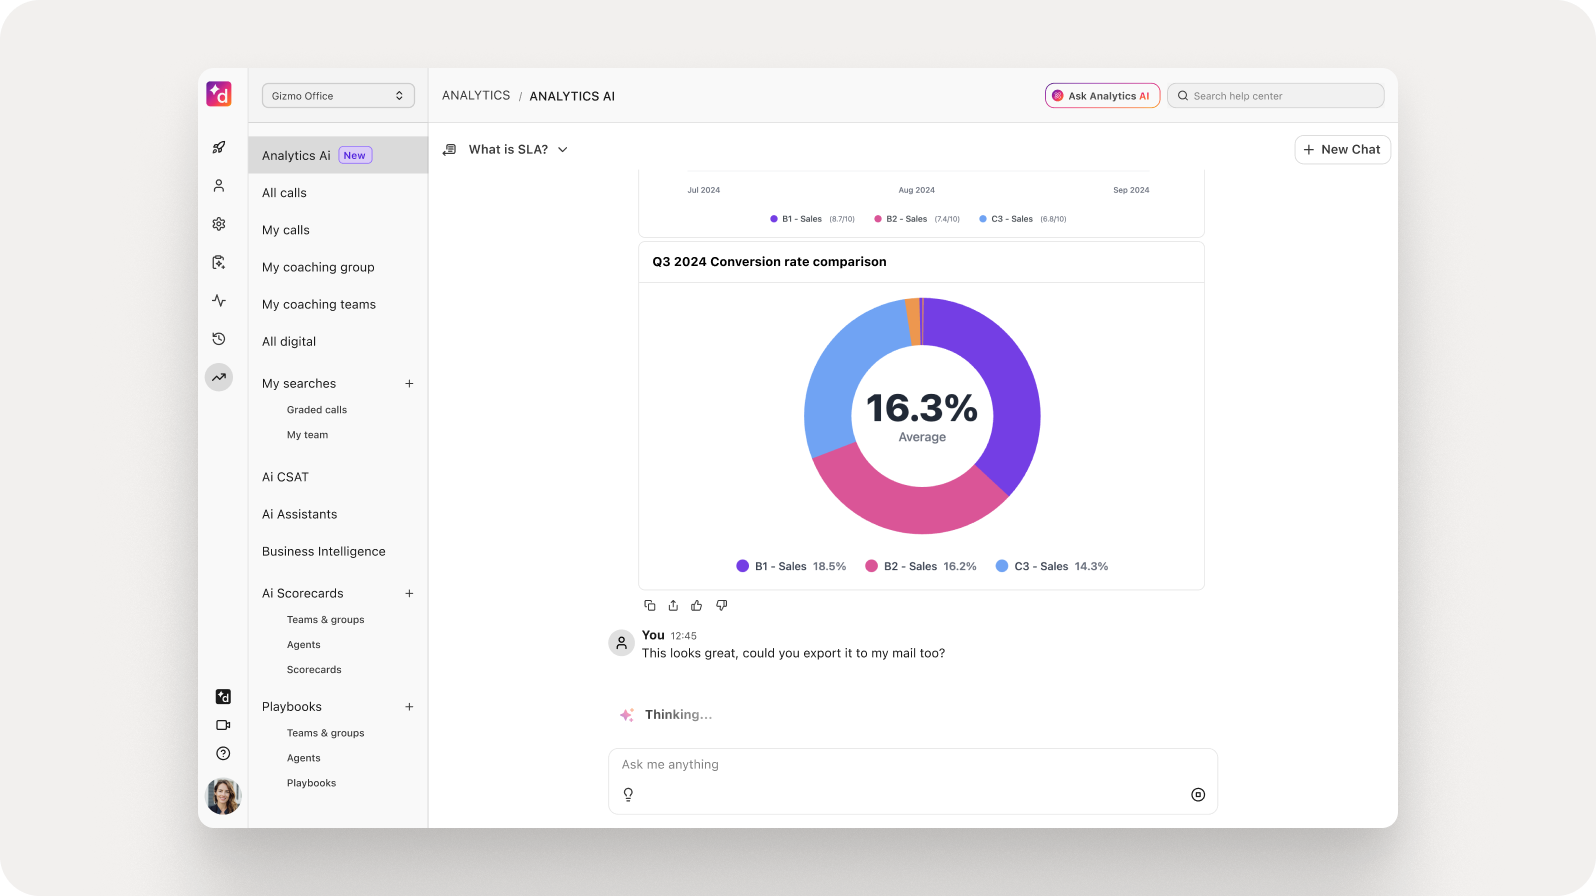
Numbers are only half the story—supervisors, and the executive teams they report to, need to see data in context. Well, rejoice—you no longer have to export raw data or rely on static dashboards when you’re preparing reports. With conversational analytics, you can get the visualization you need simply by asking for it.
Want to see agent handle times for the past week as a time series chart? Done. Need a heatmap for last week’s agent hold times? Say the word (and much richer capabilities are coming soon). Want to send a clear view of call transfer rates to your executive team? Analytics can create the visualization on the spot, tailored to the period and grouping you most care about. It’s a faster, cleaner way to turn raw metrics into decision-ready insights.
And we’re still early in this product development roadmap; by the end of October, our analytics will support flexible visualizations across common formats like time series, heatmaps, and pie charts, with the ability to switch seamlessly between tabular data and visuals.
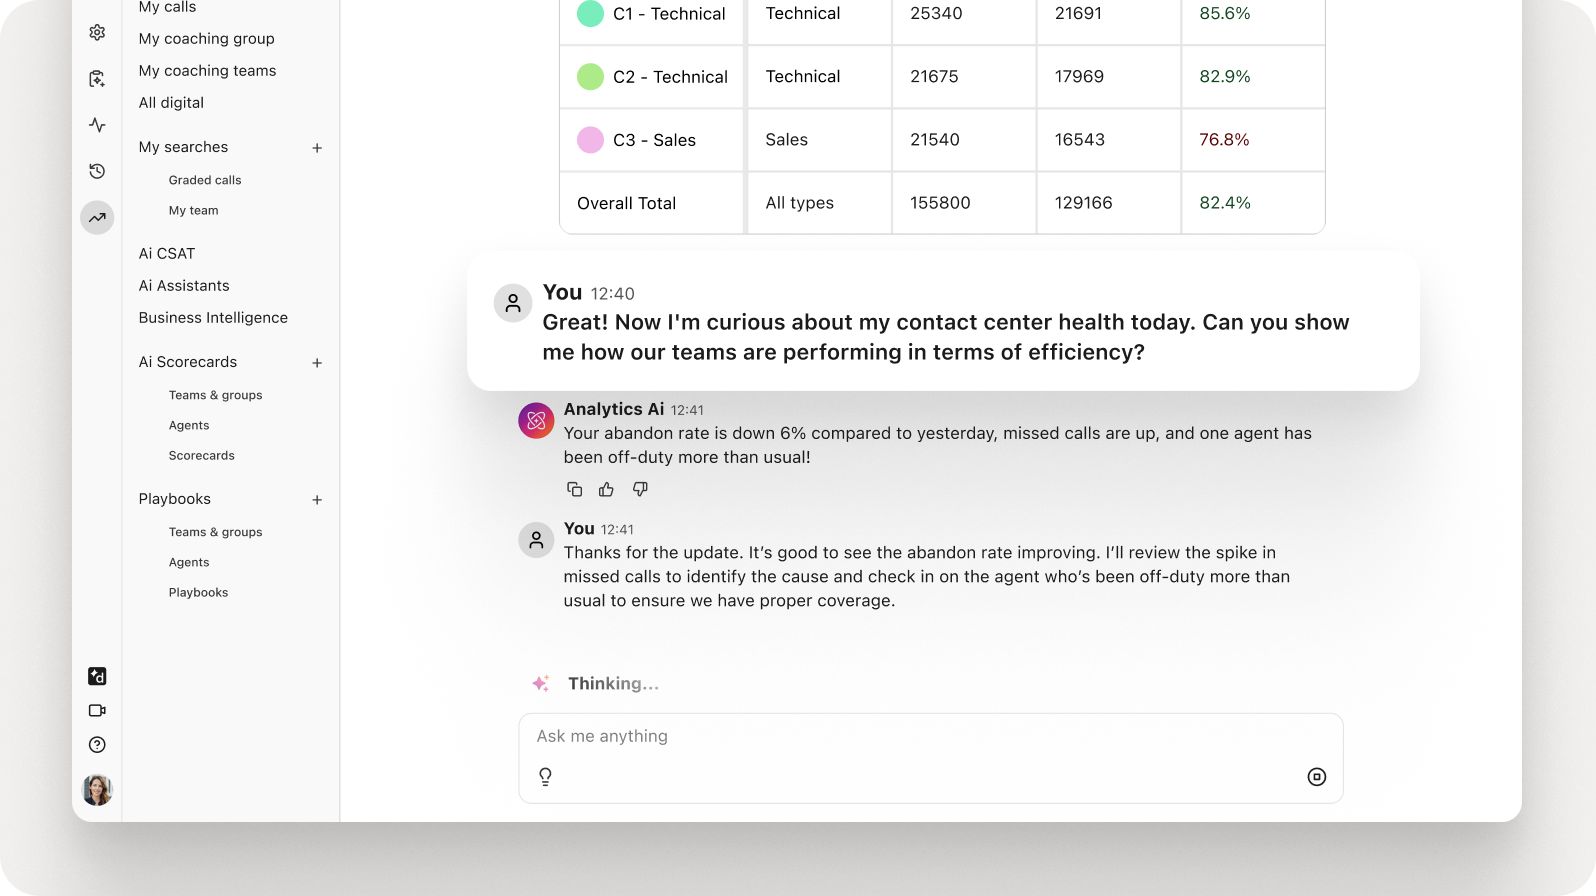
We’ll also be adding advanced dashboard summarization, which offers a synthesized view of multiple metrics. Instead of checking your abandon rate, answer rate, and missed calls one by one, just ask, “What’s my contact center health today?” and you’ll get back, “Your abandon rate is down 6% compared to yesterday, missed calls are up, and one agent has been off-duty more than usual.” For supervisors, that kind of quick, holistic snapshot can be the difference between proactively keeping performance on track and reacting after the fact.
Stay tuned for analytics that actually gets stuff done
So far we’ve been talking about understanding and visualizing contact center metrics. But the ultimate goal of data analytics is to learn why a given metric is moving up or down, and what you can do about it. There are so many possible variables—a configuration issue, incorrect thresholds, or an agent schedule that isn’t aligned with call volume.
That’s where agentic AI comes in. Dialpad Analytics doesn’t just display numbers; it explains them, and in the months to come it will start suggesting actions to take and offering to take them. It can note that “Your abandoned or missed calls have been rising because agent schedules aren’t aligned,” then offer concrete next steps that you can take yourself or assign to AI.
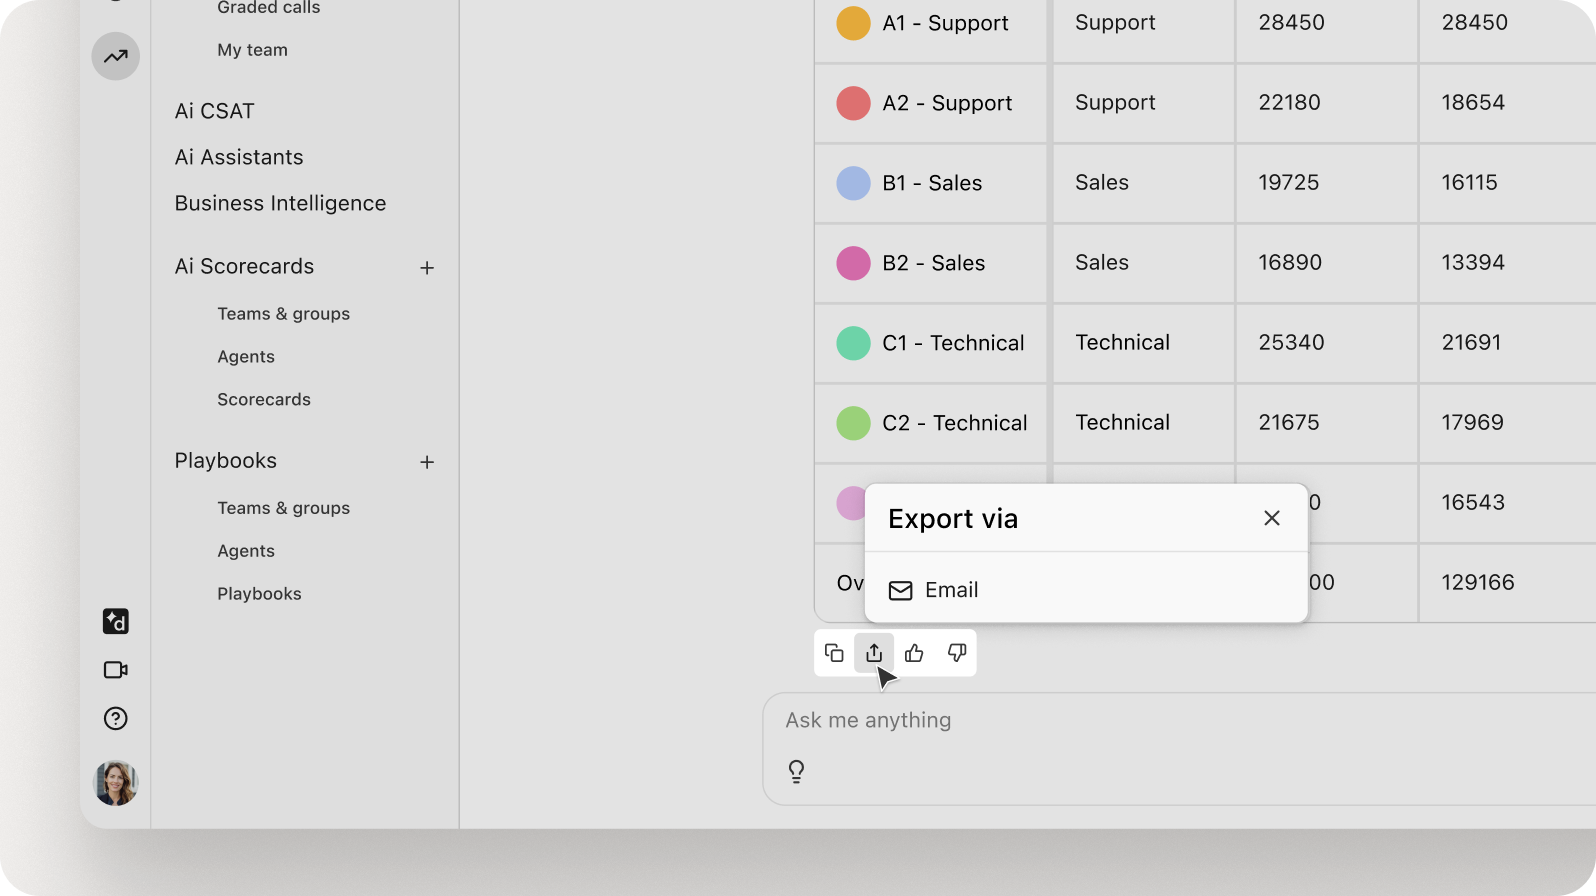
The same goes for SLA settings, CSAT, handle and hold times, and more. You can ask, for instance, “Who are my lowest CSAT-scoring agents over the past thirty days?” or “Show me my top performers by CSAT this week.” You’ll get back instant insights with personalized recommendations, and you can add those visuals back to Dialpad to update your existing dashboards or create new ones that are customized and fully integrated with the platform. For added convenience, you can even export those reports via email.
That’s the vision: conversational analytics as a capability baked into every aspect of Dialpad, so you can ask questions and turn instant answers into quick action. Whether it’s building and downloading reports, optimizing thresholds, or answering performance questions in plain language, our analytics goal is to help you spend a lot less time studying endless customer data, and a lot more time delivering incredible customer experiences.
